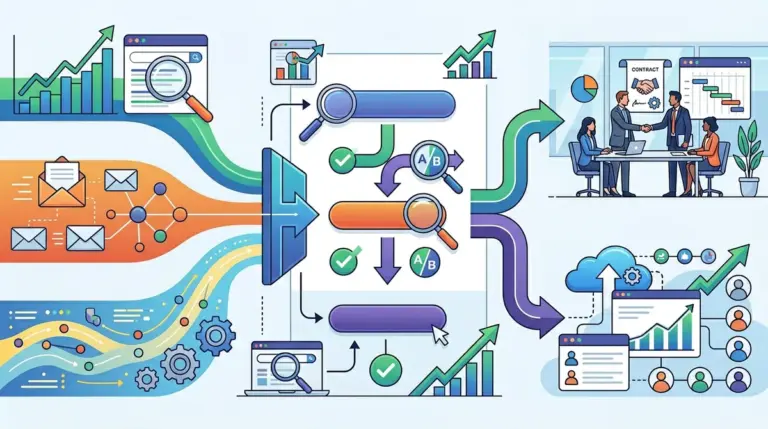


Marketing budgets are often disproportionately weighted toward acquisition. Brands spend thousands on SEO and PPC to drive traffic, yet frequently ignore the friction points that prevent that traffic from becoming revenue. Conversion Rate Optimization (CRO) is the systematic process of increasing the percentage of website visitors who take a specific action—whether that is signing up for a newsletter, requesting a demo, or completing a purchase. For an SEO professional, CRO is the necessary second half of the strategy; traffic without conversion is a vanity metric that fails to provide a return on investment.
The Financial Logic of Conversion Optimization
CRO is a lever for profitability that does not require an increase in ad spend. If a site receives 10,000 visitors a month with a 1% conversion rate and an average order value (AOV) of $100, the monthly revenue is $10,000. By optimizing the landing page to achieve a 2% conversion rate, the revenue doubles to $20,000 without spending an extra dollar on traffic acquisition. This efficiency lowers your Customer Acquisition Cost (CAC) and increases the lifetime value (LTV) of the traffic you already own.
Best for: Lean marketing teams and agencies looking to prove the direct ROI of their organic search efforts.
Quantitative Analysis: Identifying Where Users Drop Off
Effective CRO starts with data, not intuition. You must identify exactly where the "leaks" in your funnel occur before attempting to fix them. Tools like Google Analytics 4 (GA4) allow you to build funnel explorations that visualize the step-by-step journey of a user. If 80% of users drop off between the "Add to Cart" and "Checkout" pages, the problem is likely technical or related to unexpected costs (like shipping), rather than a lack of interest in the product.
Event Tracking and Funnel Visualization
Standard pageview tracking is insufficient for modern CRO. You need to implement event tracking for specific interactions:
- Scroll Depth: Are users reaching your primary CTA at the bottom of the page?
- Form Field Abandonment: Which specific field causes users to quit a lead-gen form?
- Button Clicks: Are users clicking on non-linked elements, indicating confusion?
- Error Triggers: Are validation errors on forms preventing successful submissions?
By isolating these specific friction points, you move from "guessing" what is wrong to "knowing" where the friction exists.
Qualitative Insights: Understanding the 'Why'
Quantitative data tells you what is happening, but qualitative data tells you why. A heatmap might show that users aren't clicking your primary CTA, but it won't tell you if they find the copy confusing or the offer unappealing. Qualitative research bridges this gap by gathering direct feedback from real humans.
Heuristic Evaluation and User Feedback
A heuristic evaluation involves auditing a site against established usability principles, such as clarity, urgency, and relevance. For example, does the landing page headline immediately match the intent of the search query that brought the user there? If there is a "message mismatch," bounce rates will spike regardless of how fast the page loads.
Warning: Avoid the "Best Practice" trap. Just because a competitor uses a red button or a countdown timer does not mean it will work for your specific audience. Every site has a unique "context gap" that can only be bridged through your own data, not by copying industry trends.
Direct tools like exit-intent surveys and user testing sessions provide the most granular insights. Asking a user "What is the one thing that almost stopped you from buying today?" right as they are about to leave can reveal friction points—like a lack of social proof or a confusing return policy—that no spreadsheet will ever show.
Prioritizing Experiments with the PIE Framework
Once you have a list of potential improvements, you cannot test them all at once. Doing so would muddy the data and make it impossible to determine which change caused the shift in performance. Marketers use the PIE framework to prioritize their testing roadmap:
1. Potential: How much improvement can be made on this page? High-traffic pages with high bounce rates usually have the most "upside."
2. Importance: How valuable is the traffic on this page? A checkout page is more important than a "Careers" page, even if the Careers page has more traffic.
3. Ease: How difficult is it to implement this change? A headline change is "easy," while a complete redesign of the checkout flow is "hard."
Focus on high-potential, high-importance, and high-ease tasks first to generate quick wins and secure more budget for larger experiments.
Reducing Friction in the Lead Gen Process
Friction is anything that slows down or prevents a user from completing a goal. In lead generation, friction is often structural. Long forms with ten fields are a major deterrent. Research consistently shows that reducing form fields to the absolute minimum required for a sales follow-up increases conversion rates significantly.
Best for: B2B SaaS and service-based businesses where the primary goal is a demo request or a whitepaper download.
Consider implementing "progressive profiling" or multi-step forms. By asking for the easiest information first (like a name or email) and saving the more sensitive or difficult questions for the second step, you build "micro-momentum." Once a user has started the process, they are psychologically more likely to finish it.
Technical Performance and Conversion Latency
Page speed is a CRO factor, not just an SEO factor. Every 100ms delay in page load time can result in a 7% drop in conversions. This is "conversion latency." If a user clicks an ad or a search result and the page takes four seconds to become interactive, their frustration level rises before they even read your headline. Optimization here involves technical hygiene: compressing images, leveraging browser caching, and minimizing heavy JavaScript execution that blocks the main thread. Page speed is a CRO factor, not just an SEO factor; understanding how page speed impacts conversions can significantly improve user experience.
Building a Continuous Optimization Loop
CRO is not a one-time project; it is a cycle of continuous improvement. To implement this effectively, follow a 30-day sprint model. Spend the first week gathering data, the second week forming a hypothesis (e.g., "Changing the CTA from 'Submit' to 'Get My Free Audit' will increase clicks by 15%"), the third week running the A/B test, and the fourth week analyzing the results and deploying the winner. This structured approach ensures that your marketing efforts are always moving toward higher efficiency and better margins.
Frequently Asked Questions
How much traffic do I need to start A/B testing?
To reach statistical significance, you generally need at least 1,000 conversions per month. If your traffic is lower, focus on "big swing" changes and qualitative feedback rather than granular A/B testing, as low-traffic tests can take months to produce a reliable result.
What is a 'good' conversion rate?
Conversion rates vary wildly by industry. A 2% rate might be excellent for high-ticket e-commerce, while a 20% rate might be the baseline for a free lead magnet. Benchmark against your own historical data rather than arbitrary industry averages.
Does CRO hurt SEO rankings?
When done correctly, CRO improves SEO. Google tracks user engagement signals like dwell time and bounce rate. A site that converts well usually satisfies user intent, which signals to search engines that the page is a high-quality result. Just ensure your testing software doesn't create duplicate content issues by using proper canonical tags.
Should I prioritize mobile or desktop CRO?
Look at your analytics. If 70% of your traffic is mobile but 80% of your conversions are on desktop, you have a massive mobile friction problem. Prioritize the platform where the gap between traffic share and conversion share is the largest.